
1859 Book
Colton's General Atlas with Descriptions
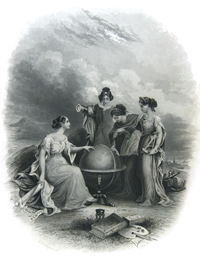
Aside from their utilitarian function and historical significance, old maps should be enjoyed as a work of art with an interesting story. And while superceded by more accurate maps and charts these records remain a valuable and intriguing glimpse of the values and assumptions of an adventurous past. (Rumsey, D., 2004) Coltons General Atlas with Descriptions of 1859 was created by Joseph Hutchins Colton. The Atlas measures 15 x 18. The cover contains the full title, embossed and gold leafed. The Atlas features one hundred seventy steel plate maps and plans, of which 45 document the United States of America. The Atlas opens with a remarkable engraving of a globe surrounded by four female allegorical figures, one holding a sextant and another leaning on a telescope. A painter's palette, an hourglass, and a book, are placed in the foreground. The composition, with its classically garbed females, and attributes representing the arts and sciences, is a reference to the mythology of the muses. The engraving is by C. Wise, after an original work, c. 1840, by F. A. Chapman. The map of the world is accompanied by general global knowledge of the time including information under the subheadings of Atmosphere, Arial Currents, Atmospheric Vapor, Climate, Electricity and Magnetism, Geographic Distribution of Plants, Geographic Distribution of Animals, and Races. The Atlas includes individual maps by continent, country, state, territory and city. Each regional map is accompanied by a survey of fundamental attributes of civilized life and geographical characteristics, namely Astronomical Position, Boundaries, Dimensions, Physical Aspects, Political, Population, Industry, Agriculture, Religion, Education, and History. Many charts and graphs of this statistical data are included. In this way, the Atlas serves also as an almanac and encyclopedia. Library statistics are included, indicating the view of libraries as paramount institutions in society in the mid-nineteenth century. As the Atlas was published just two years prior to the Civil War, the statistics include slaves and the free colored population. The lexicon is of its time. The descriptive articles include many terms that have come to be considered derogatory, as is indicated in the following excerpt from Civil Divisions, Population, Etc. of Maine. Of the population in 1850 the number of persons deaf and dumb was 266, of which 265 were white and 1 free colored, of persons blind 198, all of which were whites, of persons insane 561, of which 556 were whites and 5 free colored; and of persons idiotic 577, of which 575 were whites and 2 free colored. There are two notable inserts that serve as tools for the comparison of topographical features. This can be seen in the map titled Mountains and Rivers. While visually interesting, they also provide the viewer a context to compare inherent assets of the worlds regions. These are essentially graphs, a means of displaying the textual information contained within the atlas, visually. Coltons Atlas is a culmination of surveys and maps previously created. There are many curiosities about the maps that can be understood by the political and cultural events that led to the creation of borders and geographical features. The surveying techniques of the mid 19th century incorporated the use of several tools, including the compass, the surveyors chain for measurement, the astrolabe for locating and predicting the positions of the Sun, Moon, Planets, and Stars, the telescope, and the theodolite to measure arcs relative to points in space. The grid that is apparent in the map of the state of Iowa has historical significance. The U.S. Rectangular Survey System was developed and implemented during the late 18th century to divide states into townships. In 1784 President Thomas Jefferson issued a report to divide the newly acquired western territories calling for surveys before sales, and for the lines of these surveys to be run and marked due north and south with other lines crossing these right angles (Crazier, L., 1993). This same report called for the land to be divided into townships of six square miles. The maps of Illinois, Indiana, Iowa and Ohio are fine examples of this developing position on land proprietorship, rights, and use. The Atlas is remarkably up to date. The maps can be studied to gain knowledge of significant moments in the history of the world. Territories have changed hands, boundaries have shifted, and the geographical landscape has been altered. In 1859, the year of its publication, Darwin published his On the Origin of Species, Adolph Wilhelm Hermann Kolbe developed aspirin, the Suez Canal was initiated for trade between Europe and the East Indies, and Oregon was admitted as the 33rd state (Oregon was admitted to the Union on February 14, 1859 and is included in the atlas as a territory). The map of Boston includes the Back Bay, an area that was quite literally a bay filled to expand the city, a project begun in 1857. The intimate scale of the city maps lends itself to the display of detailed changes to the landscape. In the map of Boston, there are many more straight lines, indicative of the design, engineering, and architectural intervention of natural forces. Dams and dikes were built, rivers diverted, and bodies of water filled. The map of The Environs of Paris is stunning in its intricacy. The 19th century saw a period of rapid and significant change in the city. In 1857, Baron Haussmann was hired as City Manager by Napoleon. In Haussmanns crusade for urban renewal, he admittedly destroyed a considerable portion of the historic city. In fact, he stated in his Memoires, 1890-1893, My qualification? I was chosen as demolition artist (Byers, P.K., 1998). Seventy-one miles of new roads, four hundred miles of pavement, and three hundred twenty miles of sewers, as well as additional housing, bridges and public buildings were constructed during his term from 1857 until his forced resignation for overspending in 1870. The public accused him of Haussmannomania (Byers, P.K., 1998). The map of Paris in Coltons Atlas was created at the commencement of this transformation of Paris. Although trade between Europe and the East Indies began in the early 17th century, the infrastructure of these countries changed dramatically during the 19th century. During the 18th century, trade primarily moved east to west. Europeans grew prosperous through the acquisition of such exotic goods as silk, spices, minerals, timber, and tea. The islands of the East Indies were British, Dutch, Spanish and Portuguese colonies during the 19th century. Possession of islands and ports changed among these countries several times during this century. During this period, the European nations sought to initiate commensurate trade arrangements, in order to maintain growing economic prospects. Compensation came in the form of scientific and political advances that gave way to communications systems, roadways, health care and education. Still, the colonialism left the countries with lingering social and economic problems since their independence. Selected Bibliography
Byers, P.K. (Ed) and Baron Georges Eugene Haussmann. Encyclopedia of World Biography, 2. Detroit: Gale,1998. Crazier, L. Surveys and Surveyors of the Public Domain, 1785-1975. Washington DC: US Department of the Interior, Bureau of Land Management. 1993. Groce, G. C. and D. H. Wallace. The New York Historical Societys Dictionary of Artists in America: 1564-1860. New Haven: Yale, 1957. Rumsey, D. Cartographica Extraordinaire. Redlands, California: ESRI., 2004 Southeast Asia in the nineteenth century, 1800-1945. DISCovering World History. Online Edition. Farmington Hills, Michigan: Gale, 2003. Tufte, E. R. Envisioning Information. 6. Cheshire, Connecticut: Graphics Press, 1990. |
A Digital Initiatives Project
Long Island University, C.W. Post Campus